
Positive Control
In order to assess whether our algorithm is really powerful to find new biological relevant relationships between genes, we examined many known functionally related gene pairs as positive controls. For example, gene RPS11A and RPS11B, both of which encode ribosomal protein S11 but are located on different yeast chromosomes, are tightly clustered together (for details, please refer to our paper: Qian et al, JMB, 2001). Another excellent example for positive control is cyclins that control the yeast cell cycles.
Cyclins
Cells go through four different phases: G1, S, G2, and M, which are the traditional subdivisions of the standard cell cycle. The cycle time of a fairly rapidly dividing mammalian cell is about 24 hours (Fig. 1). For most of the cells (both prokaryotes and eukaryotes), the time of M and S phases does not vary too much, whereas G1 and G2 phases highly fluctuate. And the cells stay in different phases for different time. There are three checkpoints throughout the cell cycle: G1 checkpoint in late G1, G2 checkpoint between G2 and M, and metaphase checkpoint in late M. The cell-cyle control system is based on two key families of proteins. The first is the family of cyclin-dependent protein kinases (CDKs). The second is a family of specialized activation proteins, called cyclins, which can bind to CDK proteins and control their activities. The concentration of a specific cyclin protein inside the cell rises at a particular time of the cell cycle and falls thereafter. This results from that the expression of their genes is only activated at some time and the proteins are degraded very quickly by ubiquitination.
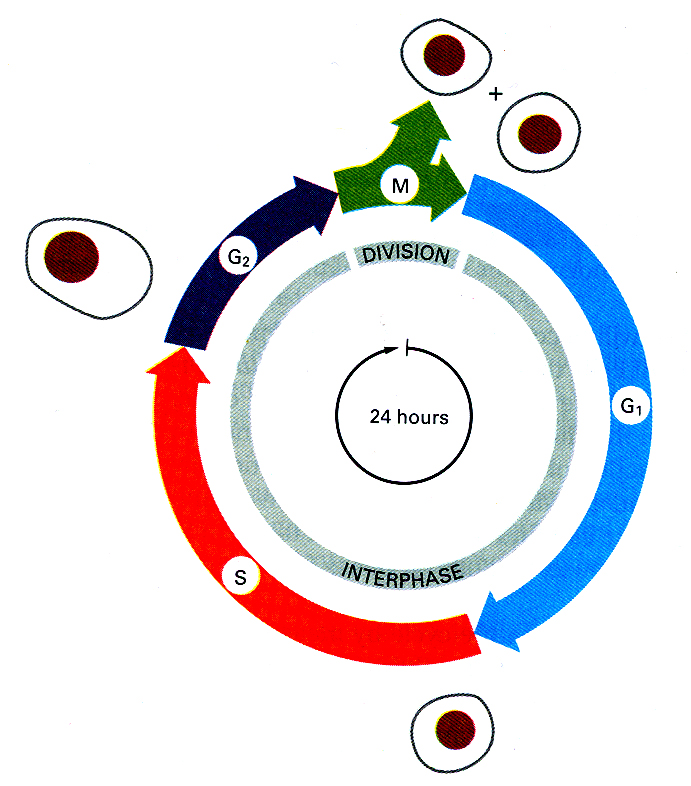
Figure 1 The four successive phases of a standard eucaryotic cell cycle (Alberts et al, Molecular Biology of the Cell, 1994).
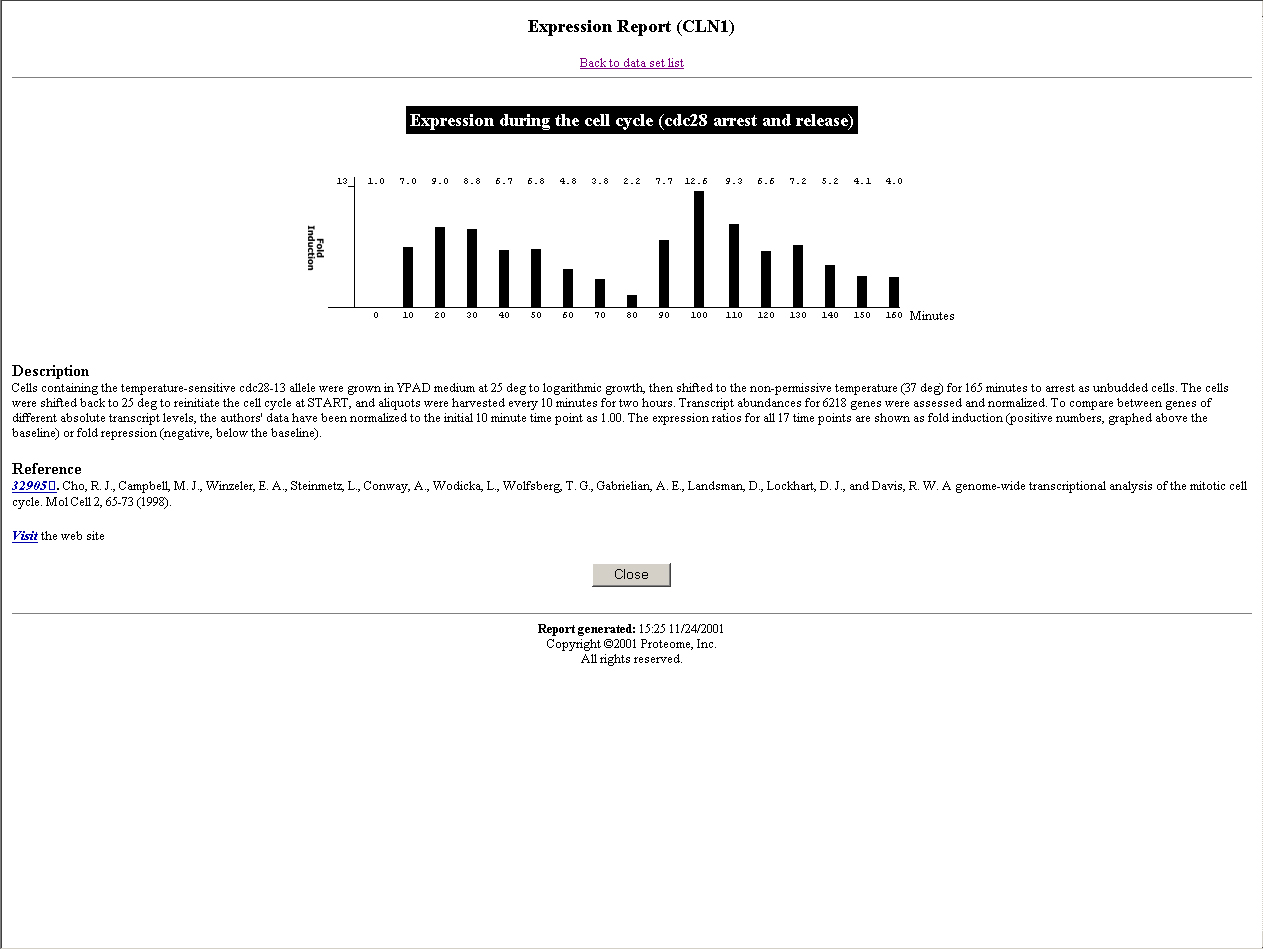
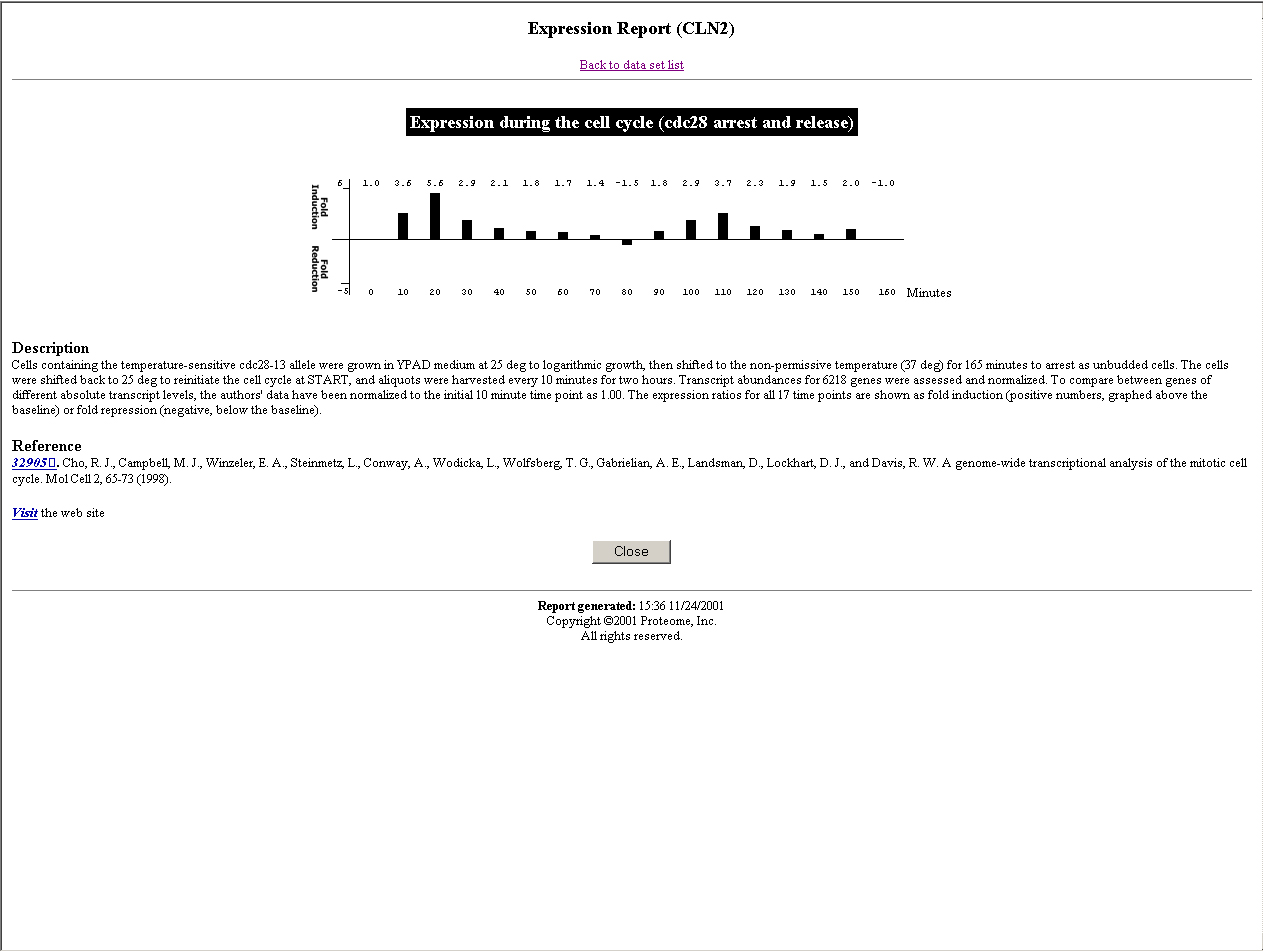
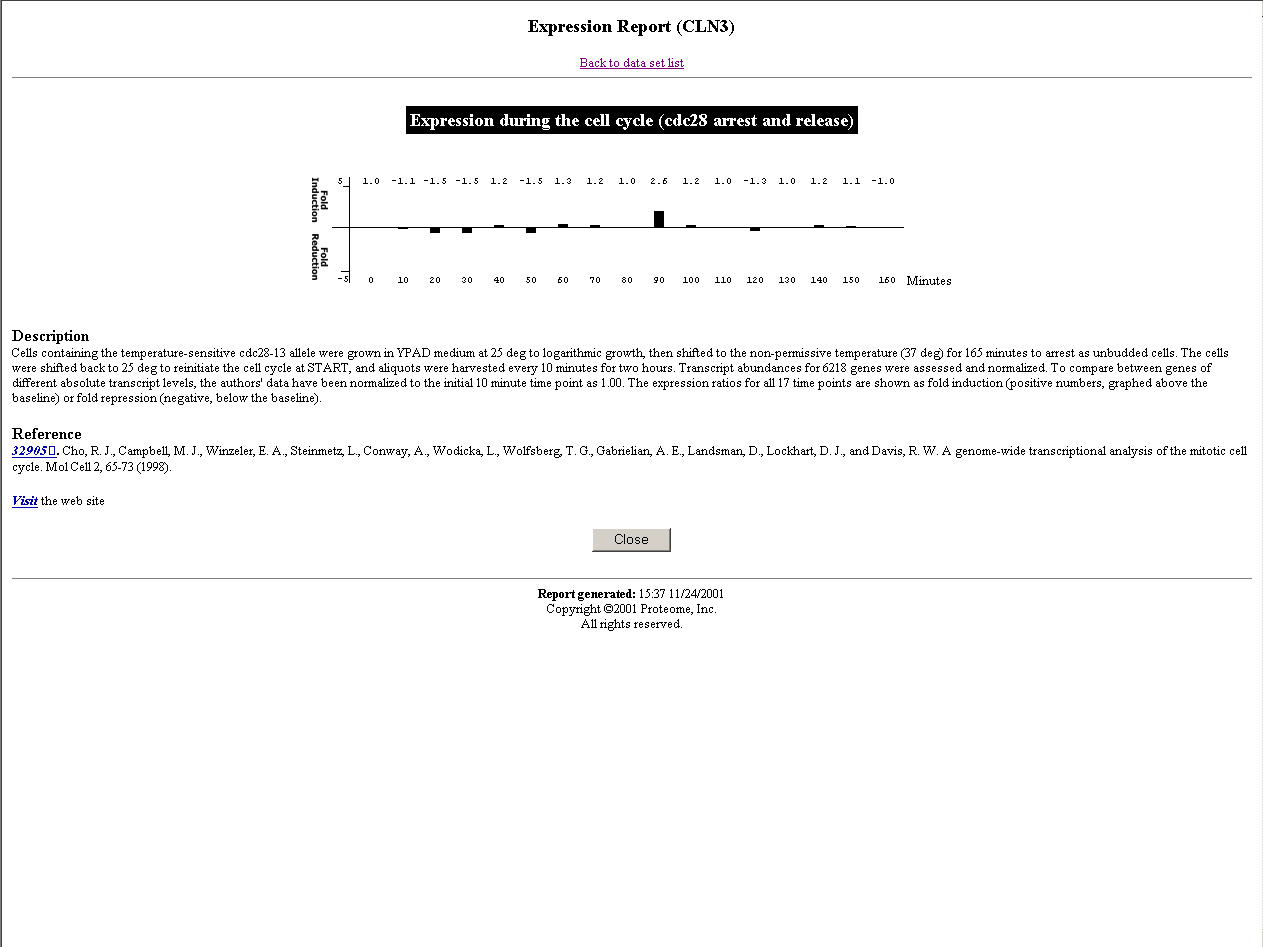
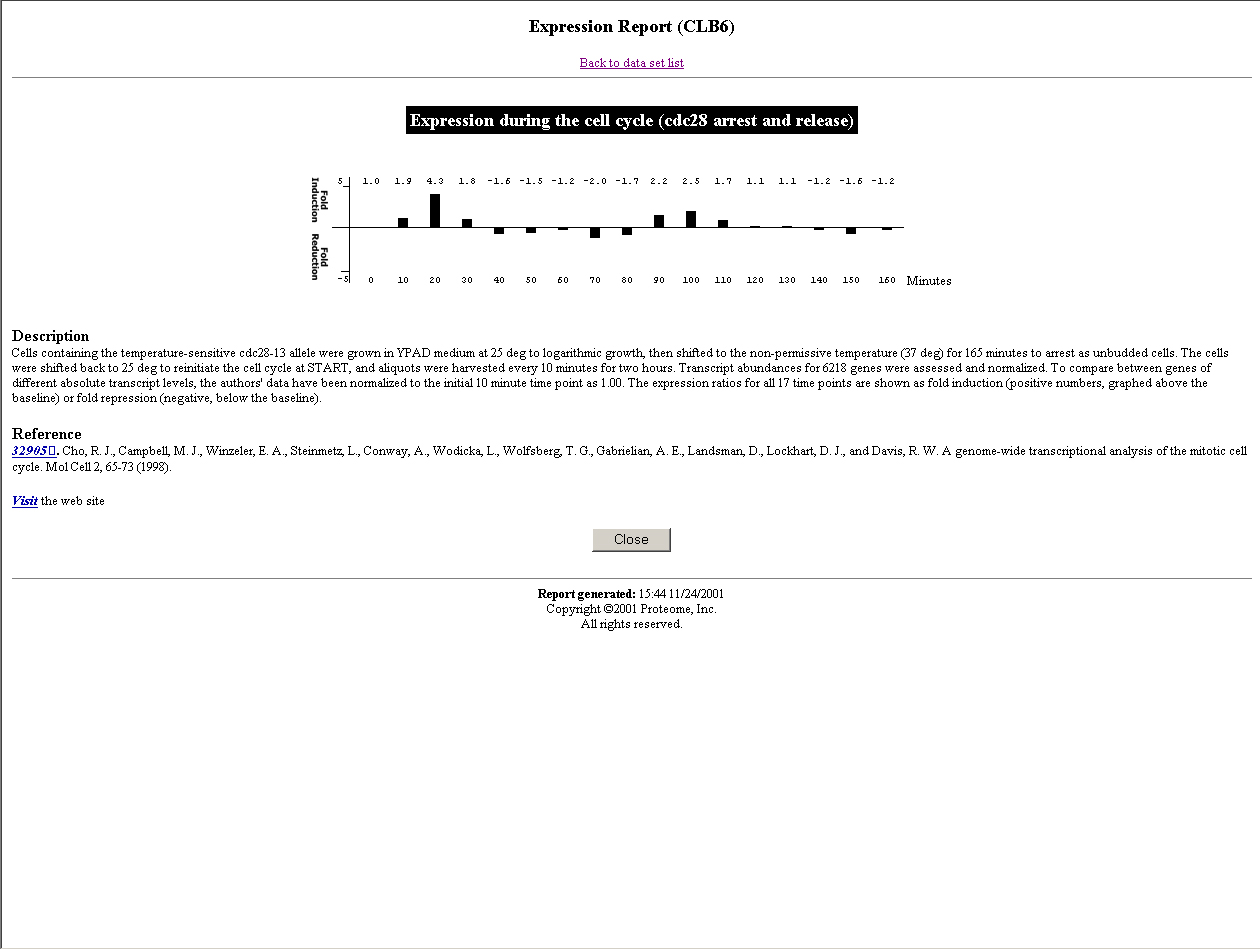
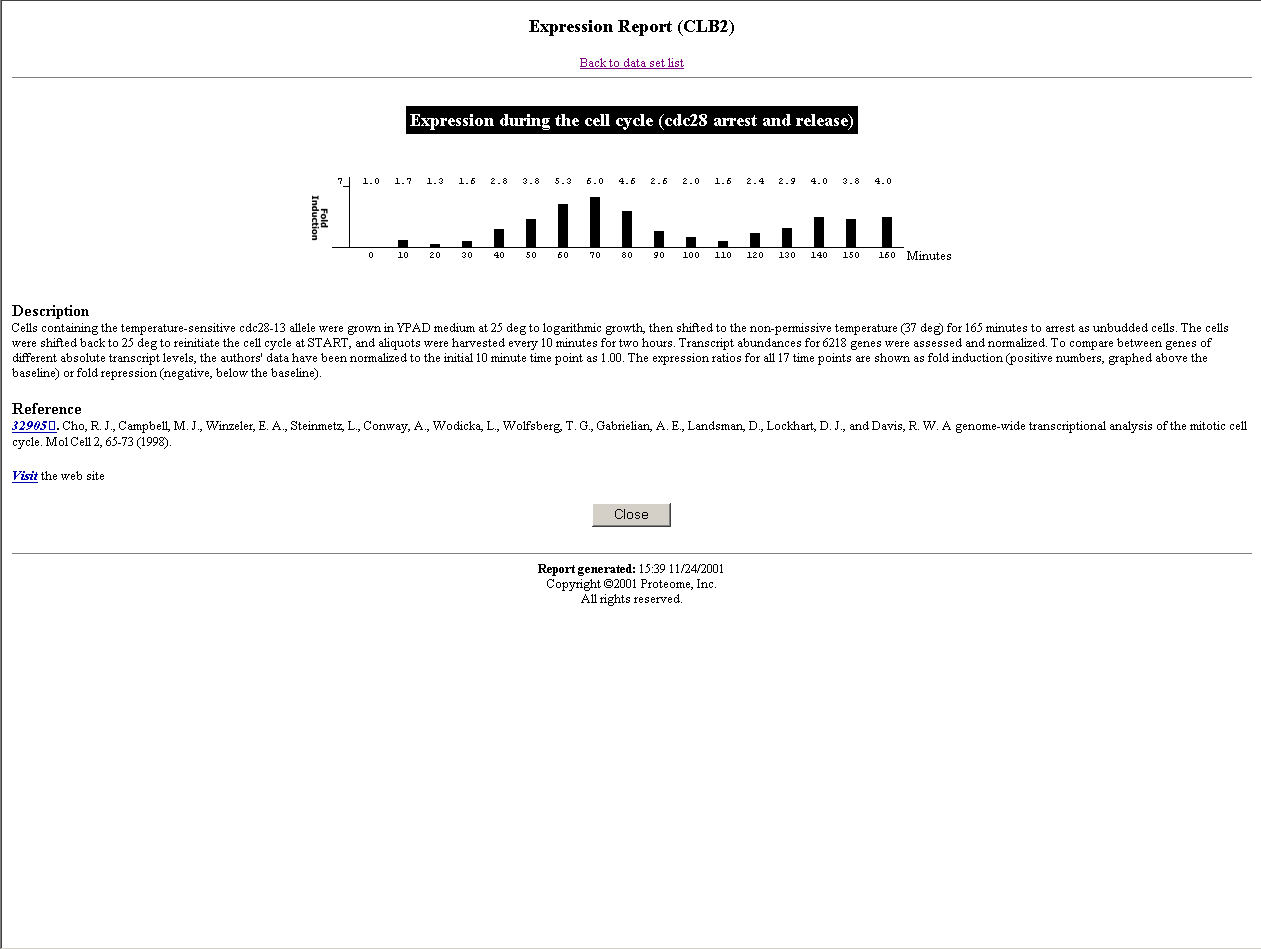
A good model organism for studying cell cycle is yeast (S. pombe or S. cerevisiae). In S. cerevisiae, until now one CDK (cdc28) and 10 different cyclins (4 clns and 6 clbs) have been identified. Due to their functions, they can be divided into three groups. Cln1, cln2, cln3, clb5, and clb6 accumulate in late G1 and promote the cells to enter S phase. Clb3 and clb4 accumulate in S and G2 phase. And clb1 and clb2 accumulate during G2 and M phase. The transcription levels of these genes have been characterized using traditional methods(Click the name of each cyclin to see its expression level from Incyte company).
CLB5 and CLB6
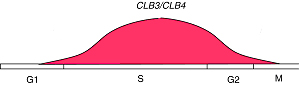
CLB3 and CLB4
CLB1 and CLB2
(The pictures are from the webpage of University of Cape Town )Using our algorithm, we did find a simultaneous relationship between clb5 and clb6 that are not defined by any other algorithms, which means that our algorithm is powerful. Now we use a very strict P-value cutoff (2.7e-3), which is purely determined by statistic significance. The match scores between clb3 and clb4, and between clb1 and clb2 are not significant enough to cluster them together. We will use lots of this kind of known related gene pairs to refine our P-value cutoff, so that the possibility of true positive is optimal and the possibility of false positive is minimum.
However, we failed to find any relationships across the groups, although there is a time-delayed relationship between the genes in different groups. For simplicity, I will take clb3 and clb5 as an example. The reason why we did not find any relationships between them is that the expression profiles of these two genes are not analogous, clb5's profile is much narrower than clb3's. To develop a new algorithm that is able to find such relationships between genes is our next step.
Reference
1. Albers, B., Bray D., Lewis, J., Raff M., Roberts K. and Watson J.D. Molecular Biology of the Cell. III. 1995.
2. Lew, D. J., Weinert, T. and Pringle, J. R. Cell cycle control in Saccharomyces cerevisiae. In Molecular and Cell biology of the yeast Saccharomyces cerevisiae. III. Cold Spring Harbor Laboratory Press. 1997.
